Friday, December 16, 2011

Filling in Sparsely Populated pivot tables in OBIEE


In this post, i will be explaining how to satisfy some complex requirements like calculating average with respect to all the records in dimension even though there are no relevant fact records.

Most of the reports like simple Order Quantity Report can be done easily with the functionality provided by the OBIEE Answers. Some complex requirements will require additional setup. For example, if instead of subtotaling Order Quantity by summing, we wish to subtotal by averaging Quantities by the number of Customers, whether or not they sold any products.

Here is the initial report that has subtotaling with a sum aggregation rule, [the default].


Here is the same report subtotaling with an average aggregation rule. 


Note that subtotals will be as desired when all cells in the column are populated. Now the FMRADIO against BR Country_Code, for example, does not have the desired results.  The subtotal displayed is 1100.   The desired value is 220 [1100/5] since there are 5 Customers. Similarly for CHARGER against BR, the desired result is 380 [1900/5].

The problem is caused by the absence of rows returned for the respective product lines. See screen shot.


No rows are returned as there are no rows in the fact table for that intersection of dimensions, (i.e. Customer [DARREN] [RAMESH] [STEVE] [DOUG], Country [BR] and products with subtype=FMRADIO).  To solve this problem, we need to join the dimensions in such a way that all values are returned, even if there is no Quantity.
To accomplish this, we will create a physical table alias based on the problematic dimension that is referenced in our report which is DIM_CUSTOMER and we will call this as DIM_CUSTOMER_ALLVALUES


NOTE: The next step is very critical.  The new alias we have created needs to be joined to the other dimension tables.  As there is usually no physical join that can be used, we will just use the clause 1=1, which results in a Cartesian join when executed by an RDBMS.  See screenhots.  Note that this join must be defined as a complex join.


Our physical diagram will look as in below screen shot once we are done creating joins.


Next step is to add this new alias to the logical fact table as one of the sources as shown in the screenshot below.


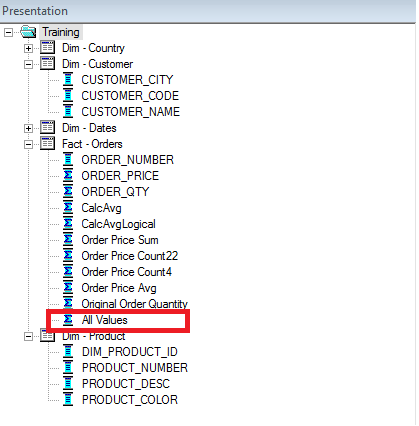
We will also create a new logical column called “All Values” in the Logical Fact Table and the formula will be just '1' for this new column as shown below. The aggregation rule will be SUM for this column in our case.


Add the All Values column to your presentation catalog.  We are ready to complete our report.


To the original request, add a filter based upon the All Values column. 


Modify the formula of Original Order Quantity column to IFNULL("Fact - Orders"."Original Order Quantity",0) in Edit Column Formula and change the aggregation rule on the column to average.


Now run the report:


We can see that even though there are no values in the fact table for some of the dimensional combinations, OBIEE is substituting the Original Order Quantity as "0" for those and then calculating the Sub Totals properly.

This approach can be used in all the scenarios where we face issues with the fact tables being sparsely populated (Normal in Data Warehouse environments).

Hope this helps.
Siva

Thursday, October 20, 2011

Load Historical Data to any Table in Oracle BI Applications Data Warehouse

Hello All,

In this post, i would be explaining how to perform a historical load on any table in your Oracle BI Apps environment. This methodology is applicable for both facts and dimensions.

First of all we need to understand the change capture logic used in the Informatica ETL Load mappings for any table. In any of the Data Warehouse table we should see columns like CHANGED_ON_DT, AUX1_CHANGED_ON_DT, AUX2_CHANGED_ON_DT, AUX3_CHANGED_ON_DT, AUX4_CHANGED_ON_DT. These columns would have directly been mapped to the LAST_UPDATE_DATE column in the source table. For example, in W_SALES_ORDER_LINE_F, the CHANGED_ON_DT column would be getting loaded from OE_ORDER_LINES_ALL.LAST_UPDATE_DATE. And if there are some other significant tables being used in the extract mapping, there LAST_UPDATE_DATE would be loaded to the AUX1, AUX2, AUX3 and AUX4.

The ETL logic would compare the CHANGED_ON_DT and other Auxiliary dates between the warehouse table and the stage table to decide whether to update the records or not the record already exists. Hence, if we need to do a complete historical load on any of the tables, first step would be to make one of these dates to NULL for all the records.

For example, if we need to do this on W_SALES_ORDER_LINE_F, we need to run below statement on the Warehouse Schema.

UPDATE W_SALES_ORDER_LINE_F SET CHANGED_ON_DT=NULL;

If we need to do this on a dimension table which is non SCD Type2, we need to run below statement

UPDATE W_PARTY_D SET CHANGED_ON_DT=NULL WHERE ROW_WID>0;

In case of SCD Type 2 dimension we need to make sure that we are including the CURRENT_FLG='Y' condition in the WHERE clause of the UPDATE query. For example if we need to perform historical load on W_PRODUCT_D the statement would look like

UPDATE W_PRODUCT_D SET CHANGED_ON_DT=NULL WHERE ROW_WID>0 AND CURRENT_FLG='Y';

Next step would be to set the dates from which we need to extract the data from source in DAC.

Here we need to understand how DAC behaves in different scenarios with respect to refresh dates.

As we know, DAC maintains the refresh dates for each of the table for all the connections under
Setup-Physical Data Source->Refresh Dates.

Note: If you have defined Micro ETL execution plans, DAC will track the refresh dates for all the tables in that EP separately. You should be able to see the EP name under the refresh dates tab for all those tables. So, if a table is used in regular EP as well as in micro EP, it will appear twice under the refresh dates tab one with the EP name and one without the EP name.

Below are the different scenarios

1. If the refresh date is not available for any of the primary source tables of a task, DAC will trigger a FULL command.

2. If the refresh date is NULL for any of the source tables of a task, DAC will use the refresh date whichever is minimum among the primary tables.

3. If same table is present in multiple EPs and the refresh date is not available in any of the EPs, DAC will trigger a FULL command.

4. If same table is present in multiple EPs and the refresh date is present in only one of the EPs, DAC will use that date for the other EP also where the refresh date is not available.

5. If same table is present in multiple EPs where one of them is Micro EP and the refresh date is latest in the non micro EP, then DAC will use the refresh date from non micro EP for the micro EP as well.

6. If the target table refresh date is less than that of the source table refresh date, DAC will use the target table refresh date and extract the data from source from that date.

Now, to do a historical load on W_SALES_ORDER_LINE_F from let's say 01/01/2000. We should execute the SQL statement given above in the Data Warehouse schema to set the CHANGED_ON_DT to NULL for all the records (Assumption here is the data that is present in W_SALES_ORDER_LINE_F is not older than 01/01/200).

After that, go to DAC Setup->Physical Data Sources->ORA_R1211(Connection that is pointing to your relational source)->Refresh Dates

Query for OE_ORDER_LINES_ALL

We have two options now. One is to set the refresh date of OE_ORDER_LINES_ALL to 01/01/2000, another is to delete that table from the refresh dates tab. If this table is present in multiple EPs repeat the step for all of the refresh dates.

Once this is done, start the Execution Plan and you should see that DAC uses the refresh date that you have set for the SDE task to extract the data from 01/01/2000 and subsequently since the CHANGED_ON_DT is NULL in the Warehouse table all the records will get updated in W_SALES_ORDER_LINE_F. If you have deleted the refresh dates, DAC will trigger FULL command any way for the SDE task to extract entire data and update the Warehouse table.

This process should be fairly straight forward if you understand the DAC Refresh Dates concept and the Informatica Update Logic in SILOS mapping. If you have any questions, you can post. I'll reply as soon as i can. Thanks.

Cheers,
Siva

Saturday, September 24, 2011

OBIEE Services Problem in Windows

Hello All,

Have you ever faced problems with OBIEE services in windows like BI Server not starting up or Presentation Server not starting up?? If yes, this post is for you....!!

Basically, we all will use services.msc to go to windows services and try to start the OBIEE services from there. If any service fails to start, then there would just be a dialogue box simply saying "Service failed to start"!!!???. We really don't know the reason since there is no proper description for the cause of failure. So, now is there a better way of starting the OBIEE services on windows which will give you the exact error causing the start up failure ?? Continue reading to know..!!

When you install OBIEE on your windows machine, all the services that needs to start in order to work in OBIEE will get installed in the installation directory as given below.

BI Server: C:\OracleBI\server\Bin\NQSServer.exe
BI Presentation Server: C:\OracleBI\web\bin\sawserver.exe
BI Java Host: C:\OracleBI\web\bin\sawjavahostsvc.exe
BI Scheduler: C:\OracleBI\server\Bin\NQScheduler.exe
BI Cluster Controller: C:\OracleBI\server\Bin\NQSClusterController.exe

When you have problem in starting any of these services, just go to command prompt and switch to the directory of the service for which you are facing the problem. For example if the BI Presentation Server is not starting up, then go to command prompt and follow the steps below.

cd c:\OracleBI\web\bin

then type sawserver.exe

This will give you the exact log of what OBIEE is trying to do in the command prompt. And you should be able to troubleshoot the problem. Follow the same process for any of the services in which you are facing an issue.

Hope this helps...!!

Siva

Wednesday, September 7, 2011

Avoid Fact Join in OBIEE Dashboard Prompts

Hello All,

I wanted to share one of the solution i came across to avoid Fact Join in the OBIEE dashboard prompts.

Problem Statement:

When created prompt with constraint enabled feature which has multiple columns from multiple dimension tables, OBIEE tries to restrict the prompt values through fact join at run time, i.e. because the only path two dimension tables could be joined is via fact. So, some of the rows get skipped and will not be shown in the prompt column as all of the dimension records might not be present in the fact table.

Solution Thoughts:

1. We can use the implicit fact column feature available in the Presentation layer. That way we can restrict the join between two dimension tables to single fact table rather than allowing OBIEE to have multiple fact table choices. But the problem with this is, still the fact table that we choose should have all the dimensional combination in it otherwise rows will be skipped.

2. We could built multiple prompts one for each dimension, but this introduces a usability issue of having multiple Go buttons and performance issues too as each Go button click will refresh the whole page.

3. Create one table with all the dimensional combination in it which can be used as a single hierarchy table. This might need an ETL to be developed. Create a new BMM with this table along with any dummy table just to make sure the RPD is consistent. Then create a subject area with this new BMM catalog as base and drag the columns required into the new subject area.

4. Add the surrogate key of the second dimension table into the first dimension table. Make sure that you don’t have duplicates before doing this. Establish a join between these two tables in the physical layer using the column we added. Create a new BMM and bring these two tables into that then establish a complex join. Create a new subject area with this new BMM as base and move the columns required into the new subject area.

After this has been done, the prompts can be created from the new subject area and the join will not go through fact table now and the values will be properly restricted.

Please make sure that

The names of the presentation tables and columns in the new prompts subject area (Which will be used to create prompts) should be same as that of the names of the tables and columns in the original subject area from which the reports are created.

If there are more than two tables on which the prompt has to be created, the approach should be changed accordingly, i.e. we may need to have all the dimensional combinations from these three tables in a single table.

Siva Pratap

Saturday, September 3, 2011

OBIEE 10.1.3.4 Grouping the Multiple Dashboards into Dashboard Menu

Hello All,

We might be searching a lot on how & where to club the multiple Dashboards in OBIEE into a Single Pull down Dashboard Menu.
The Solution is as simple as adding the Parameter below.
Before Adding the Parameter

After Adding the Parameter

Solution:
Need to add below Parameter in the Instanceconfig.xml under OracleBIData/web/config

<DashboardMaxBeforeMenu>XX</DashboardMaxBeforeMenu>

XX is the number of dashboards after which we want to group them.

Restart the Presentation Services.


Impact:

Since the Parameter is common for the Instance, it will group any Dashboards under common folder as a pull down menu

Siva

Wednesday, August 31, 2011

OBIEE Skipping Rows when performing binary join

All,

We had a strange issue with OBIEE in one of the reports that we built recently. Hope this solution will help you guys.

The report has two week selections and two scenario selections say forecast and call and based on the selections user makes, the report should display the measures from a fact table and the measure variance between the two selections. Also there is a column selector by which user can view the data by Region, Sub Region, Country, Key Account.

When the data is being viewed by Region, everything looks fine. The problem occurs when the data is being viewed by Country. OBIEE deliberately skips one of the rows in the tabular view result set. But the grand total value includes the measure value for the skipped row. Debugging further lead us to a strange path.

OBIEE has written one logical query and 3 physical queries to retrieve the result set from the DB and performing a binary join of that data before displaying on the tabular view. One of the physical queries was only to calculate the grand total. Before performing the binary join, OBIEE sorts the data retrieved from the two physical queries. After the sort has been done one of the rows was skipped because of the case mismatch.

Solution:

There is a parameter in the NQSConfig.ini file to set the case sensitive comparison on/off. In our file, the property was set to OFF hence while sorting and joining the results from two physical queries, one of the rows was skipped. After setting that property to ON, OBIEE started displaying the missing row in the tabular view.

Exact Parameter:

Change CASE_SENSITIVE_CHARACTER_COMPARISON=OFF
to CASE_SENSITIVE_CHARACTER_COMPARISON=ON

Impact:

We need to make sure that the back end database also has this property set to ON if we are changing it in the config file. If we have multiple data sources in the physical layer, then the decision to change this property depends on the usage of each data source. If the back end database has this property OFF and we set it to ON in the config file, this may give wrong results too.
If one of the data sources in the physical layer has this property ON and the other as OFF, then we may need to create multiple RPD files and put them on different instances and set this property to ON/OFF as per the data source requirement.

Hope this helps...!!

Siva Pratap

Tuesday, August 23, 2011

Increase Maximum Drop Down Values in OBIEE

All,

We will be wondering how to increase the number of values in the drop down type prompt. With the Default Installation of OBIEE - Drop down type prompt will only show first 250 values and shows the message (Too Many Values)

Solution:
We need to add a Parameter in the Instanceconfig.xml

1. Add the <Prompts><MaxDropDownValues>XXXXX</MaxDropDownValues></Prompts> where XXXXX is the number of values.
2. Restart the Presentation Services.


Impact:

Please note that providing huge values like 1000, 10000 will have performance impact to the Dashboard.

Best Regards,
Siva Pratap

ORA-01719: outer join operator (+) not allowed in operand of OR or IN after upgrading to ODI 12c

Hello All, I'm writing here after a long gap. Hope you all are doing great, and will continue to read my posts!! Recently, after upgradi...